
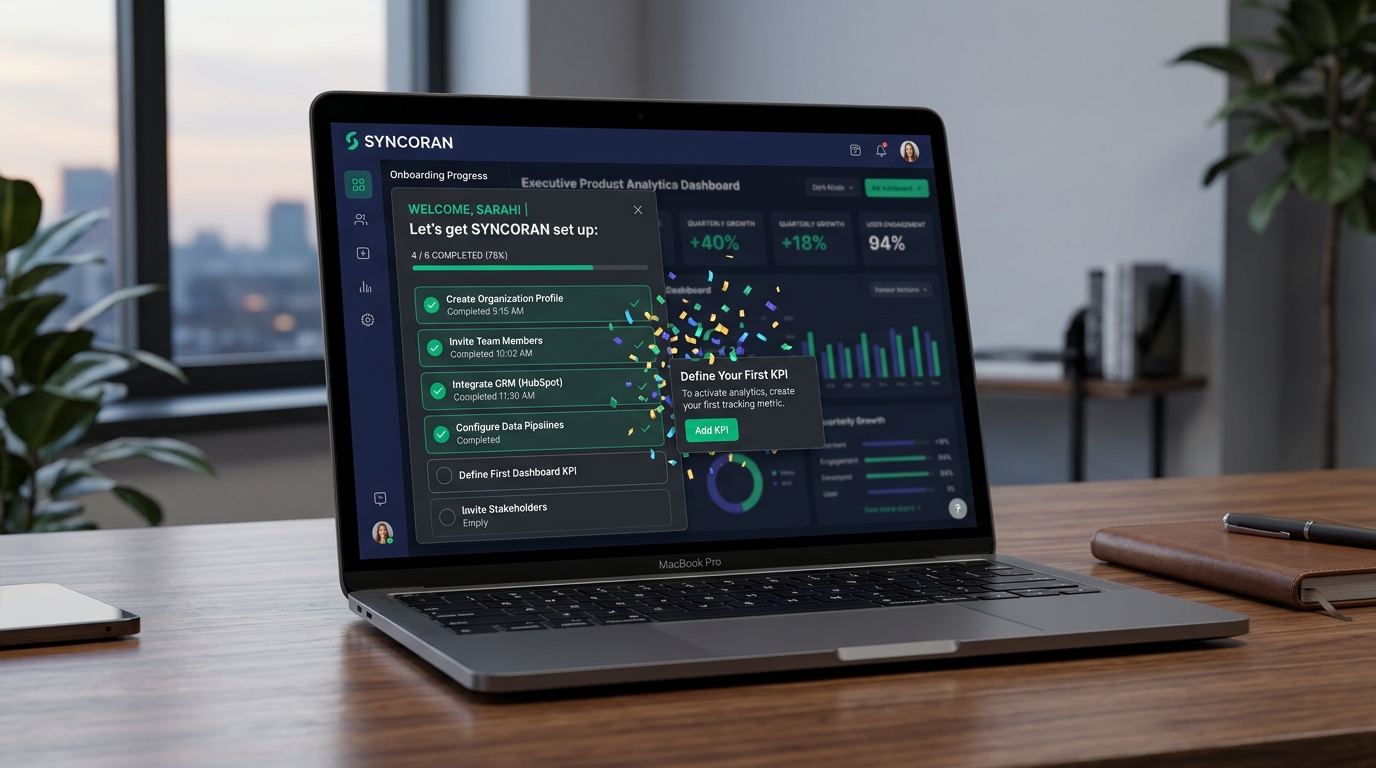
Every SaaS founder and product leader has experienced the chilling reality of user drop-off analytics: a company spends thousands of dollars on paid acquisition, developer advocacy, and content marketing to drive high-intent prospects to its signup page, only to watch over 60% of new trial users abandon the product within the first six minutes. In 2026, user patience for software friction is at an all-time low. If a user encounters a blank screen, a confusing setup flow, or an intrusive 10-step popup tour, they will close the tab and never return. Fixing B2B SaaS onboarding drop-offs is not about adding more tooltips—it is about ruthlessly eliminating the blank canvas shock and accelerating Time-to-First-Value (TTFV).
Why Do 60% of Users Abandon B2B SaaS Free Trials and How Do You Fix Onboarding Drop-Offs?
By compressing the onboarding funnel and allowing prospects to experience working product value in under 3 minutes, SaaS organizations routinely see a 35% to 50% increase in Day-7 user retention and trial-to-paid conversions.
| Onboarding Dimension | Legacy Onboarding (High Churn) | Product-Led Onboarding (2026 Playbook) | Retention Impact |
|---|---|---|---|
| First Screen Post-Signup | Blank dashboard with “No data found” alert | Pre-populated sandbox with interactive demo data | Eliminates blank canvas shock |
| Guidance Mechanism | 8-step modal tour dimming the background | Dismissible in-app checklist with progress bar | +42% Task Completion Rate |
| Authentication Gate | Forced email verification before app entry | Deferred verification banner (Immediate app entry) | +18% Initial Funnel Progression |
| Time-to-First-Value (TTFV) | 15 – 30 minutes (Heavy setup required) | Under 3 minutes (1-click starter template) | Instant dopamine confirmation |
| Day-7 Retention Rate | 12% – 18% | 38% – 48% | +2.5x Lifetime Customer Value |
Interactive In-App Checklists vs. Modal Product Tours: Why Tooltips Kill Activation
Top PLG platforms utilize the psychological endowment effect: when the user opens the onboarding checklist for the first time, Task 1 (“Create your account”) is already marked completed with a bright green checkmark, triggering an immediate sense of progress and motivation to complete Task 2.
Designing Progressive Empty States: How Sample Data and Template Starters Drive Value
Nothing kills user excitement faster than landing on a pristine, empty dashboard with a grey placeholder graphic that says “No data to display yet. Connect your PostgreSQL database to get started.” High-converting SaaS onboarding utilizes Progressive Empty States:
- Pre-Populated Demo Sandbox: Fill charts, tables, and metric cards with realistic sample data representing a healthy organization, demonstrating exactly what the product will look like when fully operational.
- 1-Click Template Starters: Rather than forcing users to configure complex workflows from scratch, offer single-click starter templates (e.g., “Start with E-Commerce Analytics Template”) that configure sensible defaults instantly.
- Interactive Sandbox Banners: Place a persistent banner at the top of the interface: “You are currently viewing sample data. [Connect Your Data] or [Clear Demo Data] when ready.” This lets users explore features risk-free before committing.
Measuring Time-to-First-Value (TTFV): The Critical Metric That Predicts Retention
To systematically eliminate drop-off points, product teams must measure and optimize Time-to-First-Value (TTFV):
- Define the Core “Aha!” Moment: Identify the exact user action that correlates with long-term retention. For Slack, it is sending 2,000 messages; for Stripe, it is completing the first test charge; for an analytics tool, it is seeing the first live event rendered.
- Prune Non-Essential Form Fields: Remove phone number requests, company size surveys, and credit card entry forms from the initial signup modal. Collect profile enrichment progressively after the user experiences core value.
- Implement Frictionless SSO: Offer single-click Google and GitHub authentication, eliminating password creation and email verification confirmation wait times.